Last updated: May 19, 2026
This page explains the method behind every number you see in Ranketta. What we sample, how we sample it, what each metric counts, and where the method has limits.
If you're evaluating AI visibility tools, this is the document that tells you whether to trust the data. If you're citing Ranketta in a roundup or comparison, this is the source.
1. Why AI visibility is hard to measure
AI answers are not search results. Three properties of how large language models respond break the measurement approaches that work for traditional SEO.
Non-determinism. Ask the same model the same question twice in the same minute and you'll often get different answers. Different ordering of brands, different citations, sometimes different recommendations entirely. This isn't a bug. It's how sampling-based generation works.
Platform divergence. ChatGPT, Gemini, Copilot, Perplexity and Grok behave differently on the same prompt. Different training data, different retrieval, different ranking, different defaults around web search. A brand can be highly visible on one platform and invisible on another.
Invisible retrieval. When a user asks "what's the best CRM for small marketing agencies", the platform often runs its own internal searches behind the scenes. The user sees one final answer. The platform may have evaluated five or ten different sub-queries to produce it. This is what we call query fan-out, and it's covered in section 5.
The consequence is straightforward: a single test prompt tells you nothing. Running a prompt once and seeing whether your brand appears is a snapshot of a probability distribution at one random draw. To measure AI visibility, you have to measure the distribution itself.
That's why our method runs on three principles: percentages over counts, frequent sampling over snapshots, and real interface scraping over API access.
In practice, when we run the same prompt repeatedly across a single day, we see meaningfully different answers a significant share of the time. The exact rate varies by prompt and platform, but it's high enough that any conclusion based on one or two runs is closer to a guess than a measurement.
2. Why we scrape the web interface, not the API
Most AI visibility tools pull data from official APIs. We don't. The reason is that what the API returns isn't what your customers see.
Three differences matter.
Different content. Providers can serve different answers, different citations, and different formatting through their API than in their web product. Sometimes a different model entirely. The API is a backend channel. If you measure it, you measure a sanitized version of reality.
Coverage that matches the user view. Some platforms don't expose every feature through their API, or expose it differently than in the product. Measuring through the same interface a customer uses means we see what they see, including features that wouldn't be reachable through a backend channel.
Different stability. APIs change, deprecate, and rate-limit. A measurement method tied to API contracts is fragile. The web interface, by contrast, is what the provider has to keep working for their users. It's the more stable target over time.
We send prompts through the browser the same way a real user does, and we capture the responses as they appear on screen. Logged-out, no personalization, the default model the platform picks for an average user.
The trade-off is honest to name: UI scraping is harder to build and maintain than API integration. It requires infrastructure that handles authentication flows, rate limits, captchas, layout changes, and the steady drift of how each platform renders answers. That cost is the reason most competitors don't do it. We made the call that the cost is worth it because the alternative is measuring the wrong thing.
3. What we sample: prompts, platforms, frequency
A visibility number is only as good as the sample it comes from. Three sampling decisions determine what the number means.
Prompts. We track conversational questions, not keywords. "What's the best CRM for marketing agencies under 50 people" instead of "CRM software". This matters because people don't talk to AI tools the way they talked to Google. The prompts we sample reflect how customers actually ask, and the answers they generate reflect what customers actually see.
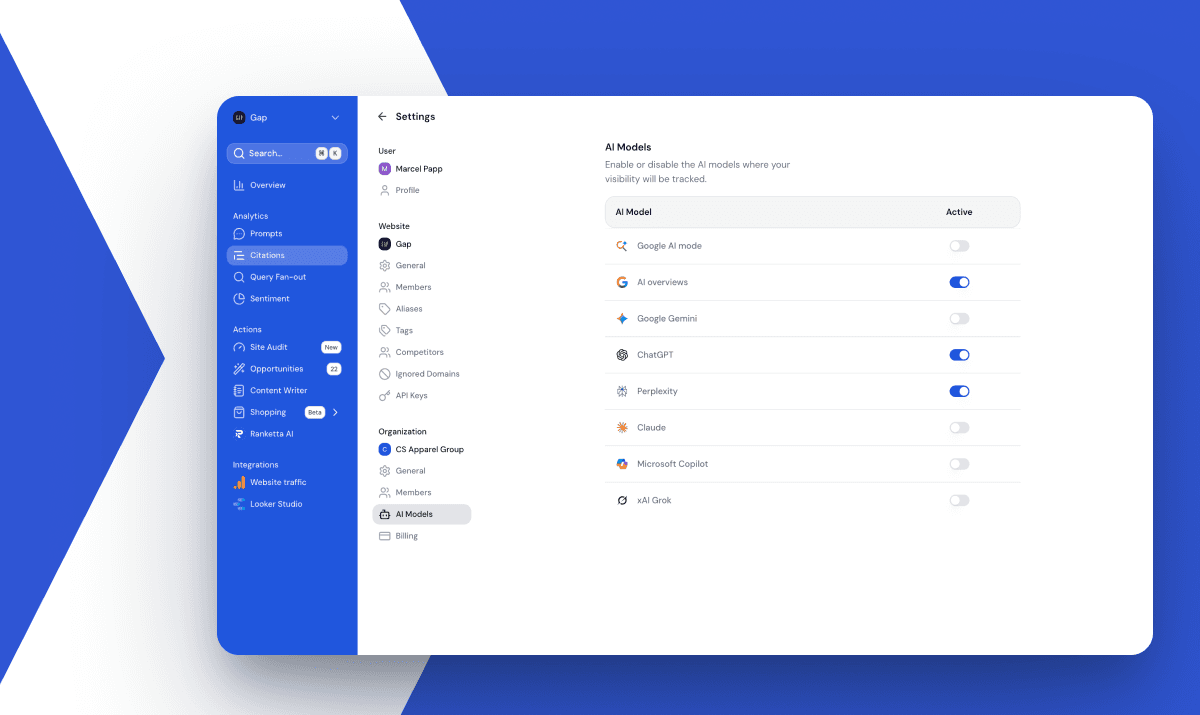
Platforms. We cover ChatGPT, Google AI Overviews, Perplexity, Gemini, Claude, Google AI Mode and Microsoft Copilot. For each one, we run prompts in a logged-out session, with the default model selection and the default web search behavior. That matches the experience of someone who isn't a power user and hasn't customized anything. It's the closest approximation to the average user, and it's the one experience that's stable enough to measure consistently.
A practical note on Google: we treat AI Overviews and AI Mode as separate surfaces, because they answer the same intent differently. Overviews is the answer block at the top of search results. AI Mode is the full conversational experience. The same prompt can produce different visibility on each, and customers care about both.
Frequency. Each prompt runs at a weekly cadence. The cadence isn't arbitrary: it's the point where the metrics stabilize at the sample sizes we collect across multiple platforms. Sampling more often inside a week doesn't meaningfully improve the numbers; the marginal information from each additional run drops sharply once a baseline distribution is established.
A practical consequence: if you check your visibility today and check it again tomorrow, small movements are noise, not signal. A meaningful trend usually takes about 7 days of consistent direction to be confident about.
We also have to decide what counts as the brand appearing in an answer. A brand "appears" when its name is mentioned in the response text, when its domain is cited, or when one of its products is recommended by name. For brand names that overlap with common words, we apply disambiguation rules at the prompt level, which a customer can review and adjust.
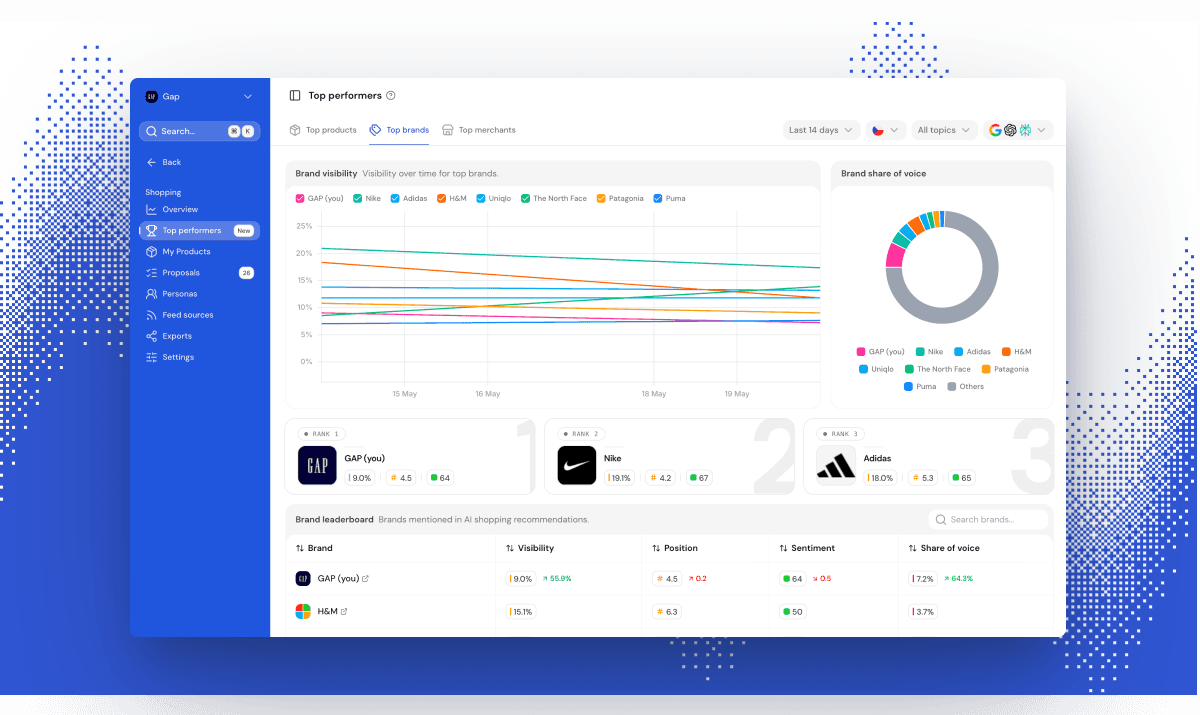
4. The four metrics, plain-language
Ranketta reports four metrics. They answer different questions, and they can move independently.
Visibility
Visibility = (responses where you appear / total responses) × 100
The share of AI answers that mention your brand at all. If we ran a prompt 100 times and your brand appeared in 25 of those answers, your visibility is 25%. This is the headline metric for "how often does AI mention me on this question". Use it for tracking presence over time. It's misleading when used in isolation, because a brand can have 80% visibility and still always be mentioned last, after every competitor.
Average position
Where your brand typically appears in the answer. Lower is better. First in a list is position 1, second is 2, and so on. We detect order in narrative answers, not just bulleted lists, which means we have to interpret "X is the leading option, though Y is also worth considering" as a position signal. Use position alongside visibility to see whether you're mentioned and whether you're mentioned prominently. It's misleading on its own because a brand mentioned in position 1 in 5% of answers is worse off than one in position 3 in 60% of answers.
Sentiment score
How positively or negatively the response talks about you. We classify each mention as positive, neutral, or negative using an LLM-based classifier, and we calibrate the classifier against human-rated samples periodically to catch drift. The score is reported as a percentage. Use sentiment to spot when visibility is rising but the framing is hostile, or when a quiet brand is being recommended warmly. It's misleading when the sample is small, because a single negative mention swings the score more than it should.
Share of voice
SoV = your visibility / sum of all tracked brands' visibility
Your slice of the total brand attention on the prompt. Visibility tells you absolute presence. Share of voice tells you presence relative to competitors. Use it to track whether you're gaining ground in a category or just riding a category-wide trend. It's misleading if your competitor set is incomplete, because brands you don't track aren't in the denominator.
5. How we handle query fan-out
When you ask "what's the best project management tool", a platform like Perplexity or Gemini often runs multiple internal searches before answering. It might query "project management software comparison", "best PM tools 2026", "PM tool recommendations small teams", and a few others. You see one answer. Behind that answer is a fan of sub-queries that shaped what the model retrieved.
This matters for visibility because a brand can be highly visible on the main prompt and invisible on specific fan-out variants. If you rank well for "best project management tool" but never appear for "PM software for distributed teams", you're losing a use case without seeing it in the headline metric.
We capture query fan-out separately for each prompt and each platform that exposes it. For each fan-out query, we report visibility, position, and sentiment, the same way we do for the parent prompt.
The honest limit here is that platforms expose fan-out unevenly. Some surface their internal queries directly. For others, we infer them from observable behavior. We label which is which in the product, so you know whether a fan-out is observed or estimated.
6. Product-level vs brand-level tracking
Most AI visibility tools track brand mentions. "How often does Nike appear in answers about running shoes." That's useful in B2B and brand awareness contexts.
In e-commerce it's the wrong unit of measurement.
E-commerce sells SKUs. A buyer asking AI for "best running shoes for flat feet under $150" doesn't convert on a Nike mention. They convert on "the Nike Pegasus 41 is a good option for overpronation, $130 on Nike's site". The product mention is the conversion event. The brand mention is a near miss.
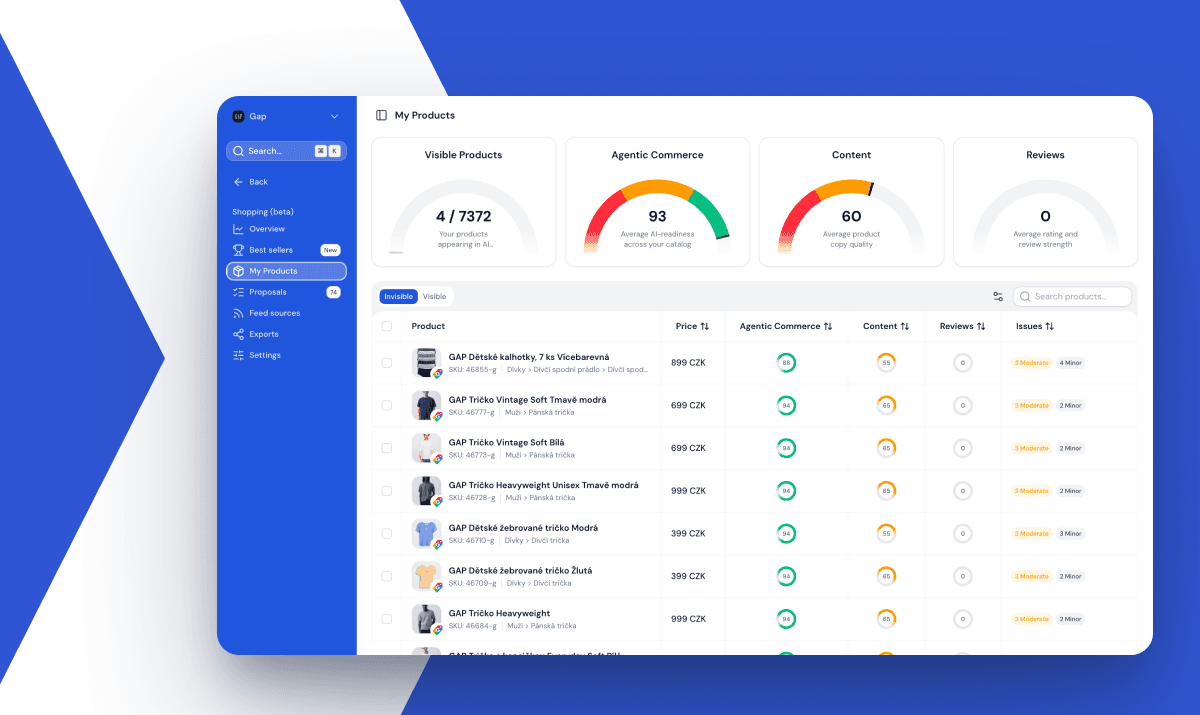
Ranketta tracks both. For e-commerce customers, the meaningful metric is product-level visibility: how often a specific SKU appears in AI answers, in what position, with what sentiment. We integrate with product feeds (Shoptet plugin, custom feeds for other platforms) to know which products belong to which brand and to normalize product names across the variants that AI tools use.
A concrete pattern we see often: a brand has 40% brand-level visibility on a category prompt and only 8% product-level visibility on the same prompt. The brand is mentioned. No specific product is. That gap is actionable. It usually means the brand has authority signals but no product-level content that AI tools can pull from. Without product-level tracking, the gap is invisible.
7. What we don't measure (and limits we acknowledge)
A methodology is only credible if it names its limits. Here are ours.
Personalization. We measure the logged-out experience. For a logged-in user with a long history, AI platforms personalize answers based on past interactions and preferences. We don't capture that. The trade-off is that personalized experiences are different for every user and can't be aggregated into a stable metric. The logged-out experience is the lowest common denominator across users and the cleanest baseline.
Voice and multimodal. We track text-based interactions. Voice queries and image-based prompts produce different answer patterns and different retrieval behavior. We don't currently capture them.
Geographic and language coverage. Every prompt is tied to a country, and Ranketta tracks across 70 countries today. That covers the major markets in Europe, North and South America, Asia and the Middle East. Language is implied by country plus prompt text, not a separate setting. If you write a Czech prompt for the Czech Republic, you measure the Czech-language experience; if you write the same intent in English for the UK, you measure that.
Data latency. When something changes in how a platform answers a prompt, it takes time for the change to stabilize in our metrics. We need enough samples after the change to distinguish signal from noise, which typically means several days before a movement is reliable.
Coverage gaps. Some AI surfaces aren't yet covered. Niche regional platforms, voice assistants, and feature-specific experiences inside larger platforms. We add coverage as it becomes operationally feasible.
If you spot something in this methodology that doesn't match what you see in the product, or you want to challenge a definition, write to us. Methodology is the part of the product we want challenged.